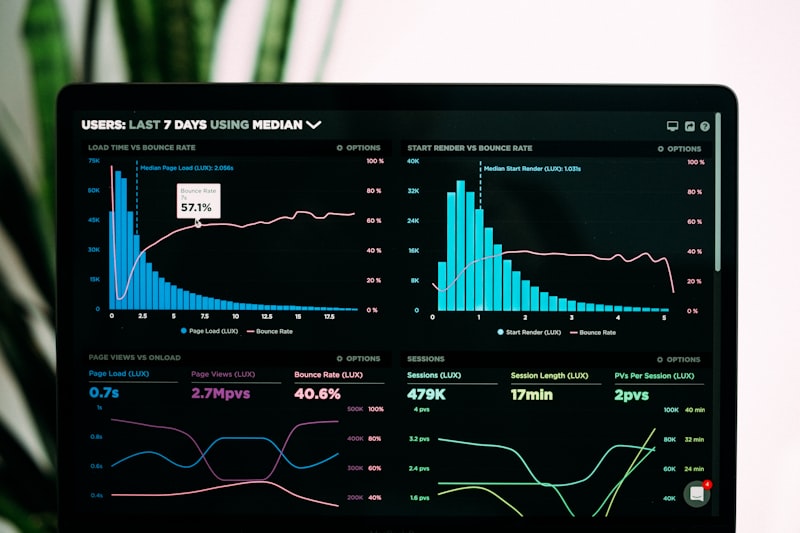
Flutter performance optimization begins with profiling on real physical hardware using DevTools to identify whether bottlenecks stem from UI thread computations, GPU rasterization, or memory pressure. Key fixes include localizing widget rebuilds, using const constructors, offloading heavy computations to background isolates with Isolate.run(), and eliminating expensive overdraw using RepaintBoundary.
- Always profile in Profile mode on physical devices, never in Debug mode.
- Target frame budgets: 16.6ms (60Hz), 11.1ms (90Hz), 8.3ms (120Hz).
- Offload JSON parsing and heavy synchronous operations to Isolate.run().
- Use RepaintBoundary around frequently animating or custom-painted elements.
- Dispose all AnimationControllers, Streams, and TextEditingControllers in dispose().
One of Flutter's greatest advantages is its ability to compile directly to native ARM machine code and render graphics with GPU acceleration. However, achieving locked 60fps and 120fps on real production devices requires disciplined architecture and profiling.
Understanding Flutter's Rendering Pipeline & Frame Budget
Every frame in Flutter moves through a pipeline before reaching the physical display:
User Gesture ➔ Build Phase ➔ Layout Phase ➔ Paint Phase ➔ Compositing ➔ Rasterization (GPU) ➔ Frame DisplayTo prevent dropped frames (jank), all UI thread and GPU raster work must complete within the display's refresh interval:
- 60Hz Screens: 16.67 milliseconds per frame.
- 90Hz Screens: 11.11 milliseconds per frame.
- 120Hz Screens: 8.33 milliseconds per frame.
Tip 1: Localize Widget Rebuilds & Extract Subtrees
Calling setState() at the root of a large widget tree forces Flutter to execute the build() method on dozens of child widgets unnecessarily. Instead, extract stateful interactive controls into dedicated leaf widgets or use granular state listeners:
// ❌ Bad: Rebuilds entire screen on counter increment
setState(() { counter++; });

// ✅ Good: Localized widget rebuild with ValueListenableBuilder
ValueListenableBuilder<int>(
  valueListenable: counterNotifier,
  builder: (context, value, child) {
    return Text('$value', style: const TextStyle(fontSize: 24));
  },
);
Tip 2: Use const Constructors Everywhere
When a widget is marked const, Flutter creates a single canonical instance in memory and completely skips rebuilding it when the parent widget updates. This minimizes garbage collection overhead and keeps memory allocations flat.
Tip 3: Offload Heavy Tasks to Background Isolates
Dart executes on a single-threaded event loop. Running expensive synchronous tasks—such as parsing large JSON payloads (5MB+), image filtering, or local database encryption—blocks the UI thread and immediately produces dropped frames. Use Isolate.run() to offload work seamlessly:
// Parse a large JSON dataset on a background thread without UI jank
Future<List<Product>> fetchProductsInBackground(String rawJson) async {
  return await Isolate.run(() {
    final List<dynamic> decoded = jsonDecode(rawJson);
    return decoded.map((item) => Product.fromJson(item)).toList();
  });
}
Tip 4: Isolate Repaints with RepaintBoundary
When a small element animates frequently (e.g., a pulsing status dot or a custom audio visualizer), Flutter may repaint the entire parent container. Wrapping the animating widget in a RepaintBoundary isolates its paint layer into a separate GPU display list:
RepaintBoundary(
  child: AnimatedLoadingPulse(),
)
Tip 5: Use ListView.builder() with itemExtent for Large Lists
Instantiating hundreds of widgets inside a standard ListView(children: [...]) instantiates all items at once in memory. Always use ListView.builder() to lazily build only visible rows, and specify itemExtent if row heights are fixed to eliminate layout calculation passes during fast flings.
Tip 6: Optimize Image Caching & Decoding Dimensions
Loading a 4K (3840×2160) image into a 100×100 avatar thumbnail consumes unnecessary megabytes of RAM. Use ResizeImage or cacheWidth / cacheHeight to downsample images during decoding:
Image.network(
  imageUrl,
  cacheWidth: 200, // Decodes and caches image at exact display resolution
  fit: BoxFit.cover,
)
Tip 7: Avoid Expensive Opacity Compositing Layers
The generic Opacity widget creates an off-screen compositing buffer that forces the GPU to render twice. When fading widgets, prefer AnimatedOpacity or apply opacity directly to colors:
// ❌ Expensive GPU buffer
Opacity(opacity: 0.5, child: Container(color: Colors.black))

// ✅ Fast direct color opacity
Container(color: Colors.black.withValues(alpha: 0.5))
Tip 8: Always Dispose Resources in State Lifecycle
Failing to cancel stream subscriptions or dispose controllers is the leading cause of memory leaks in Flutter:
@override
void dispose() {
  _animationController.dispose();
  _textEditingController.dispose();
  _streamSubscription.cancel();
  super.dispose();
}
Frequently Asked Questions on Flutter Performance
How do I know if my Flutter app has performance issues?
Run your app in Profile Mode (flutter run --profile) on a real physical Android or iOS device. Open Flutter DevTools and inspect the Performance View. If frame render bars exceed 16.6ms and turn red, your app is dropping frames.
Why should I never measure performance in Debug mode?
Debug mode enables assertions, extra logging, and the JIT (Just-In-Time) compiler, which intentionally runs significantly slower to support Hot Reload. Profile and Release modes compile with AOT (Ahead-Of-Time) machine code optimization and disabled debug checks.

Afaq is a mobile product engineer with 4+ years of experience shipping production Flutter applications, 120fps graphics architectures, and AI model integrations across iOS and Android.
Flutter Bug Fixing & Performance →
Audit and eliminate UI jank, memory leaks, and frame drops.
LQDCNVS - 120fps TV & Mobile Performance →
Explore real production architecture and benchmarked results for this stack.